Decisions people stand behind
In every group the loudest voice too often decides, and the sticky notes from a workshop are never seen again. ConceptAtlas surfaces what really matters, lets the group organise it themselves, and computes a shared picture: where you agree, where you do not, and where it makes most sense to start.
The method
No loose sticky notes, but an evidence-based picture: ConceptAtlas follows the published Group Concept Mapping method (Kane and Trochim) and goes one step further with simulation.
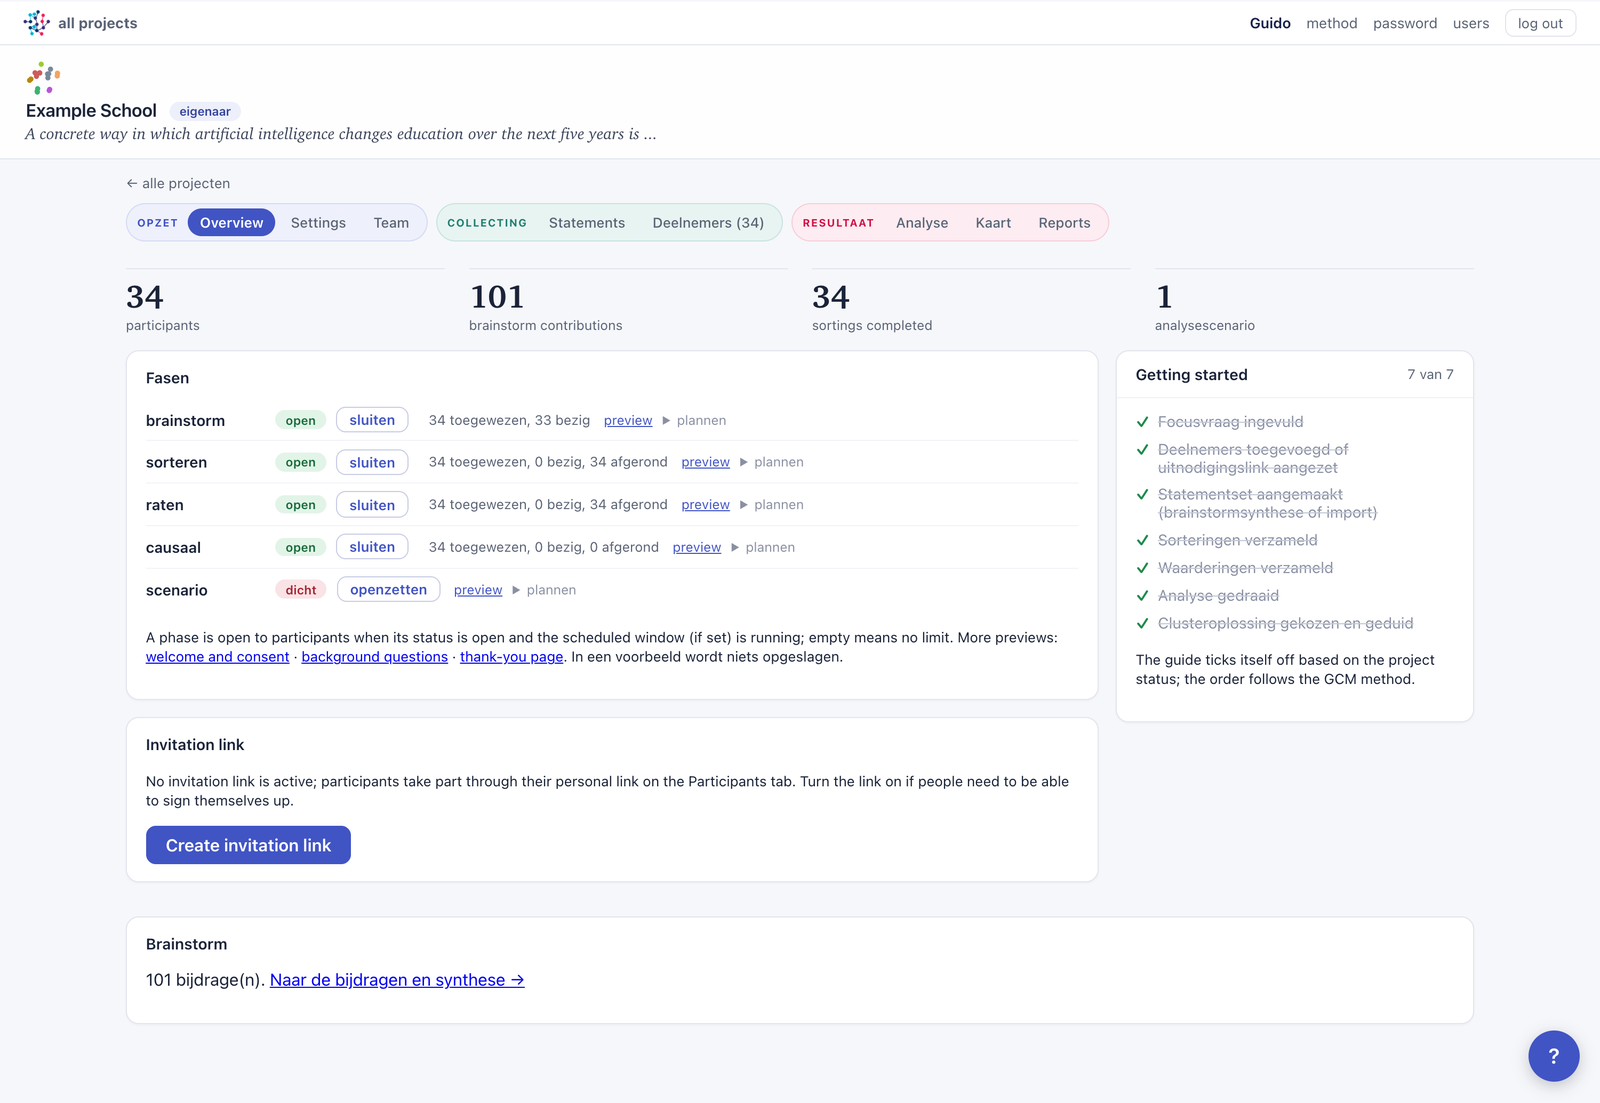
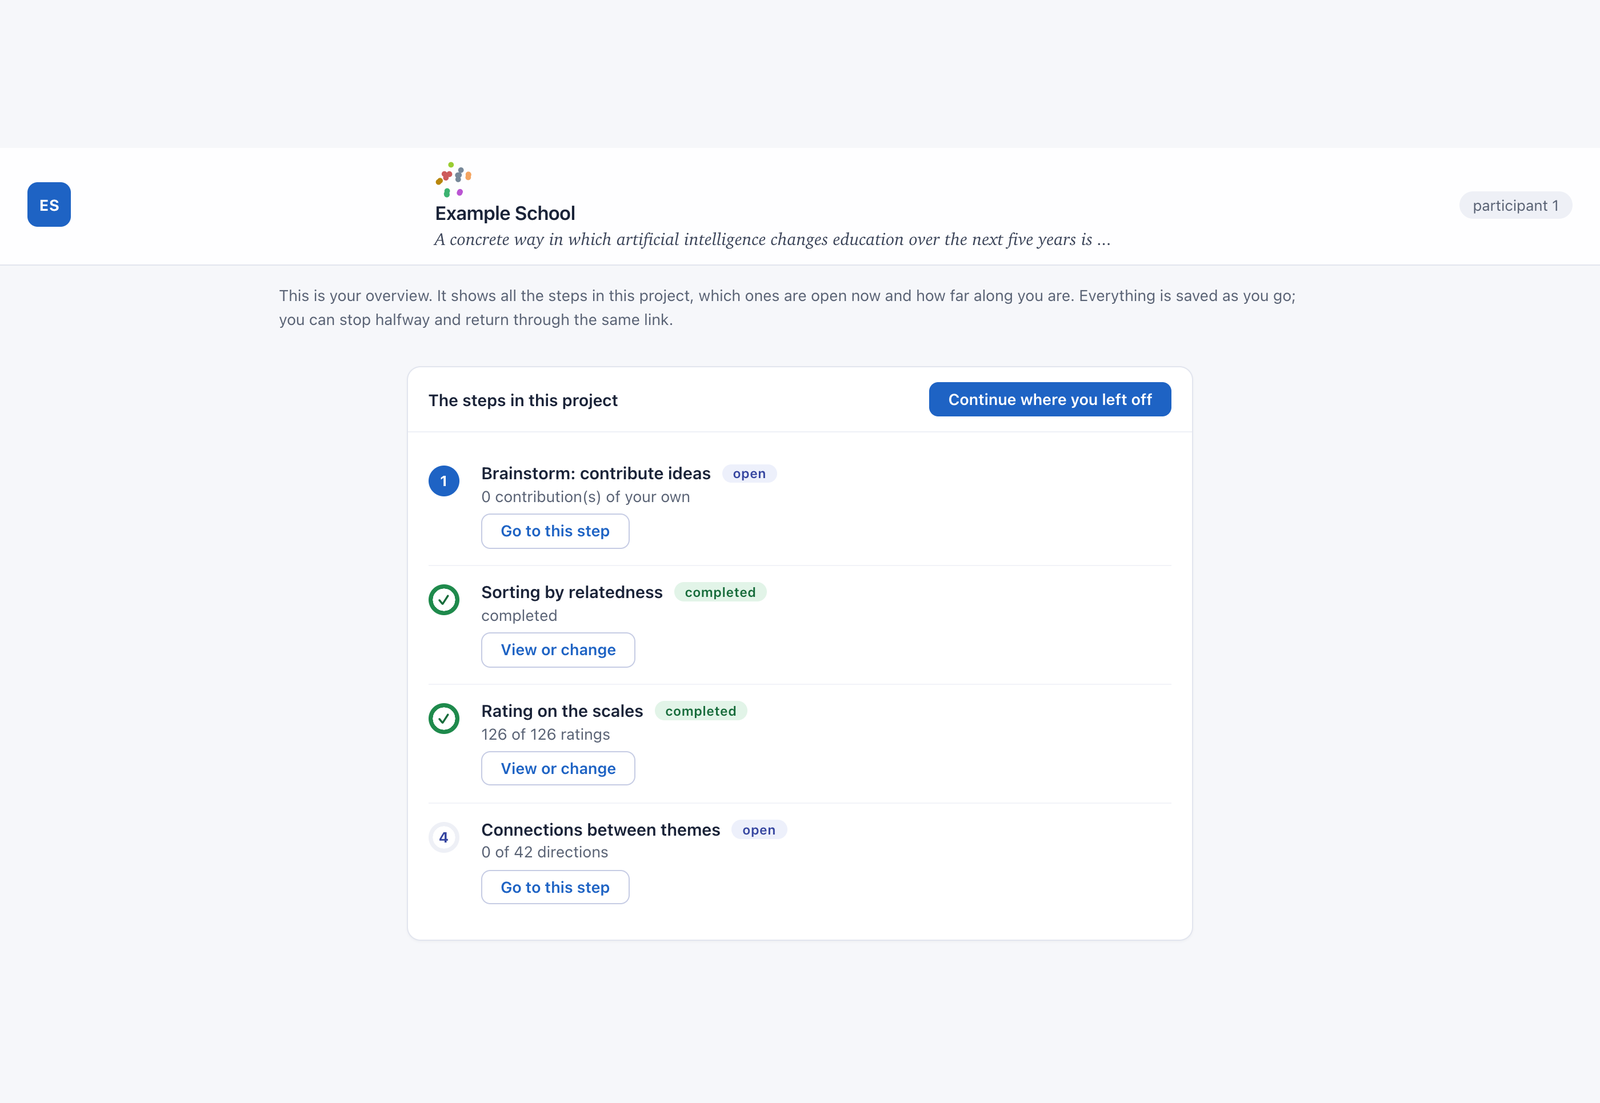
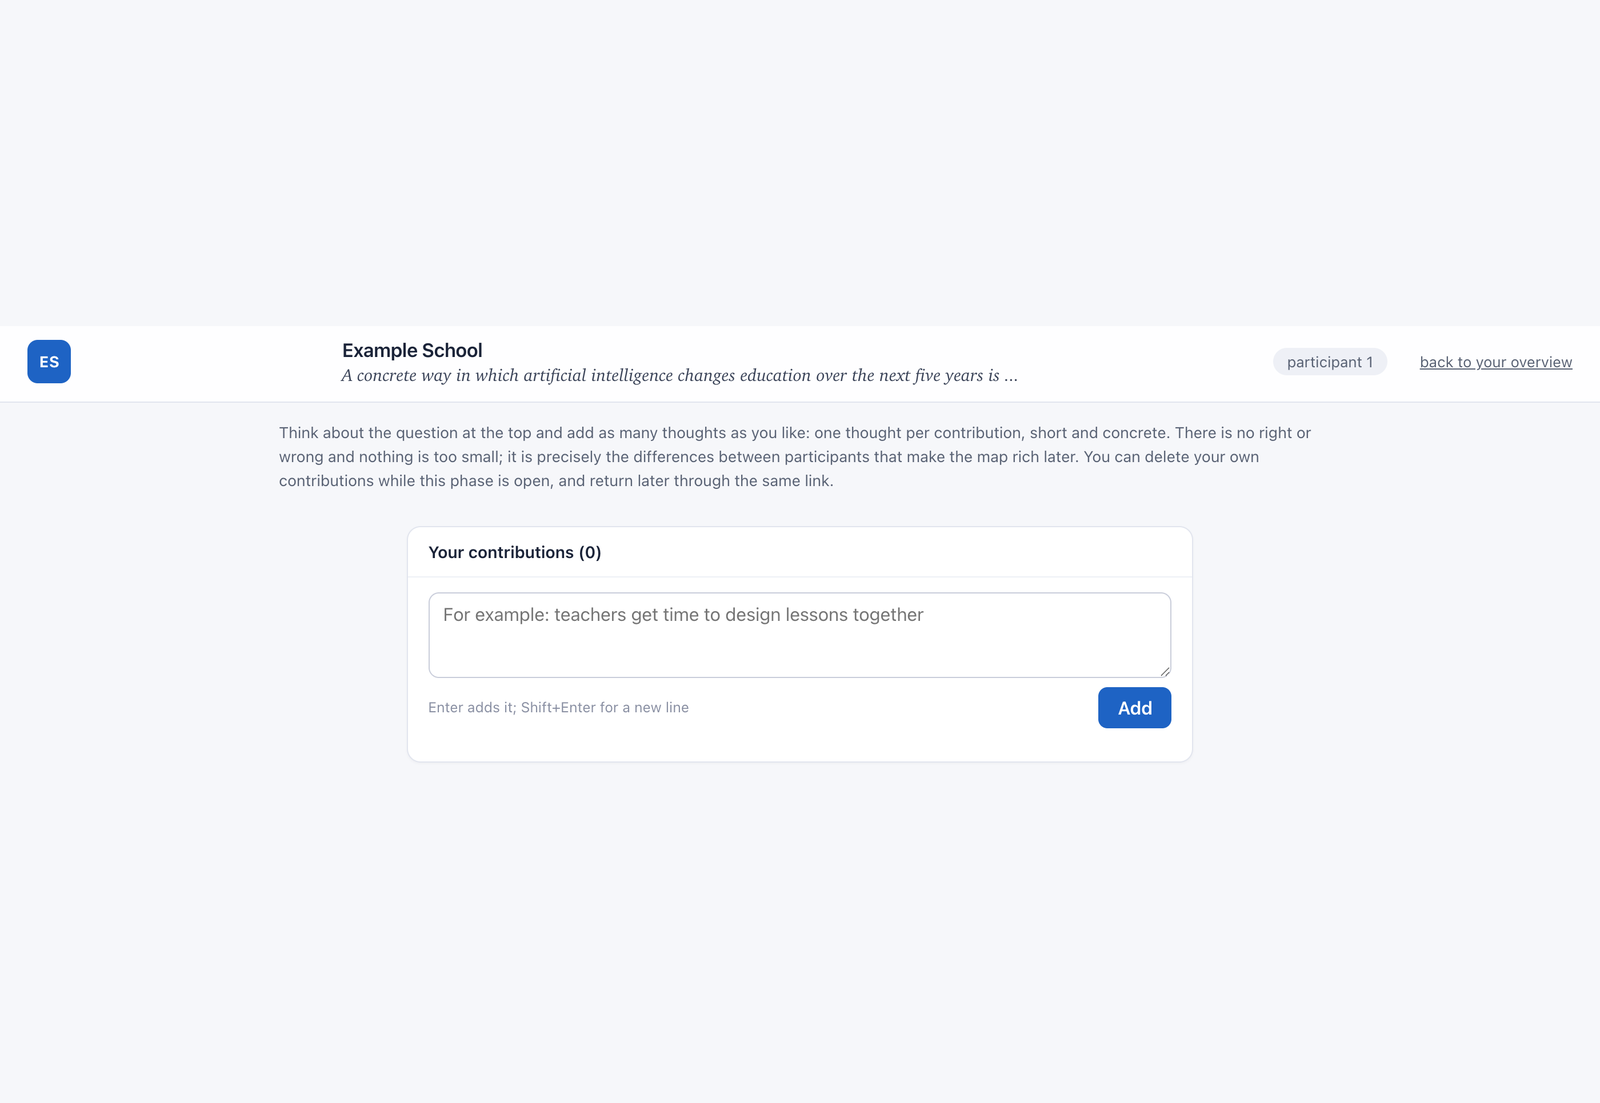
Collect ideas from the group.
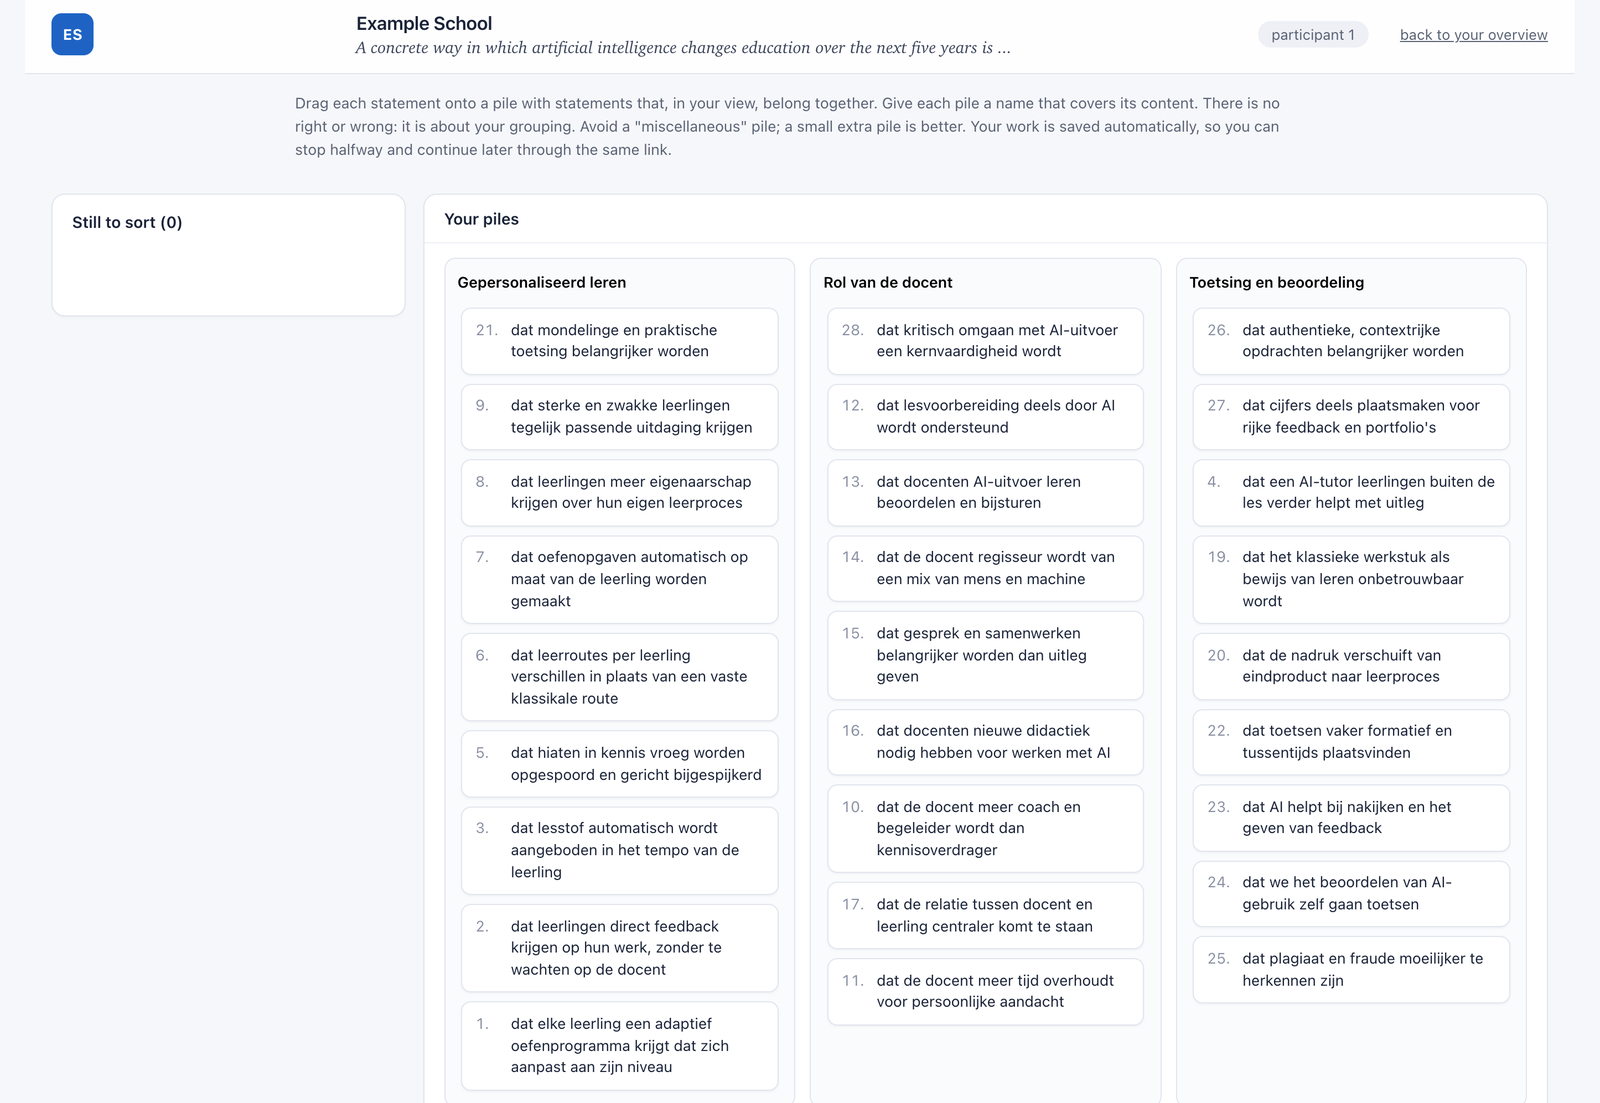
Statements into your own piles.
Scored on two scales.
Themes out of the data.
Naming and deciding.
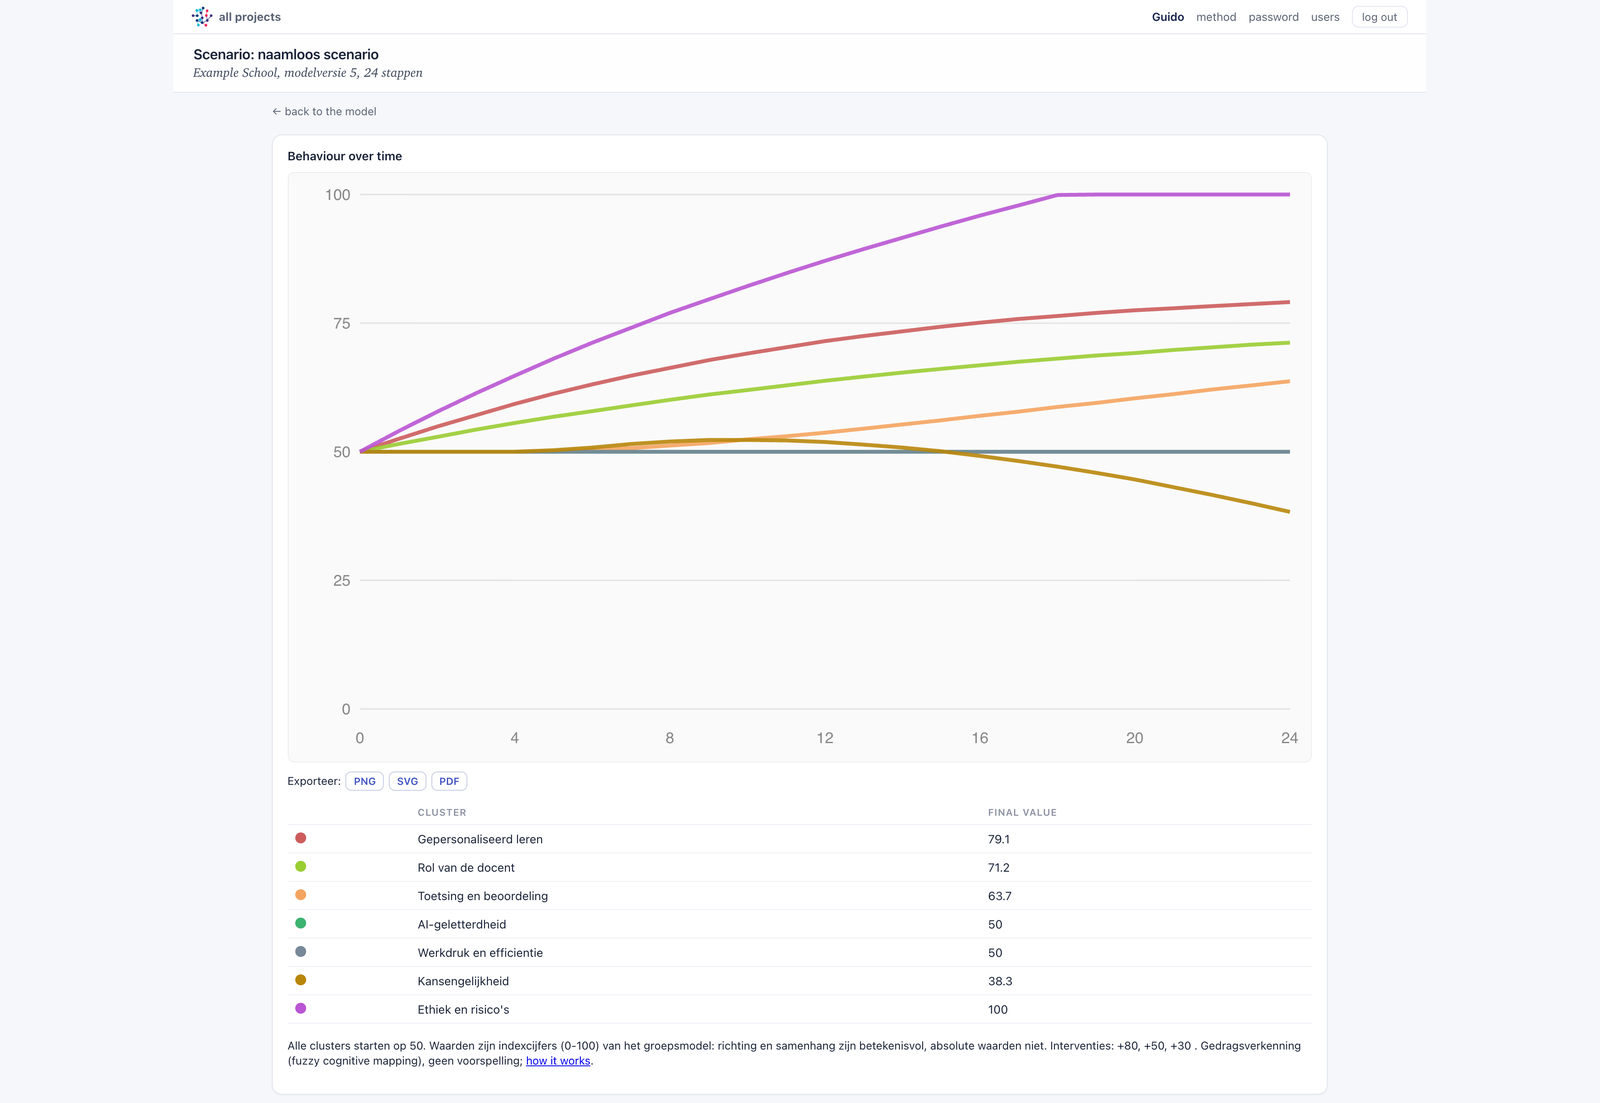
Scenario's doorrekenen.
In pictures
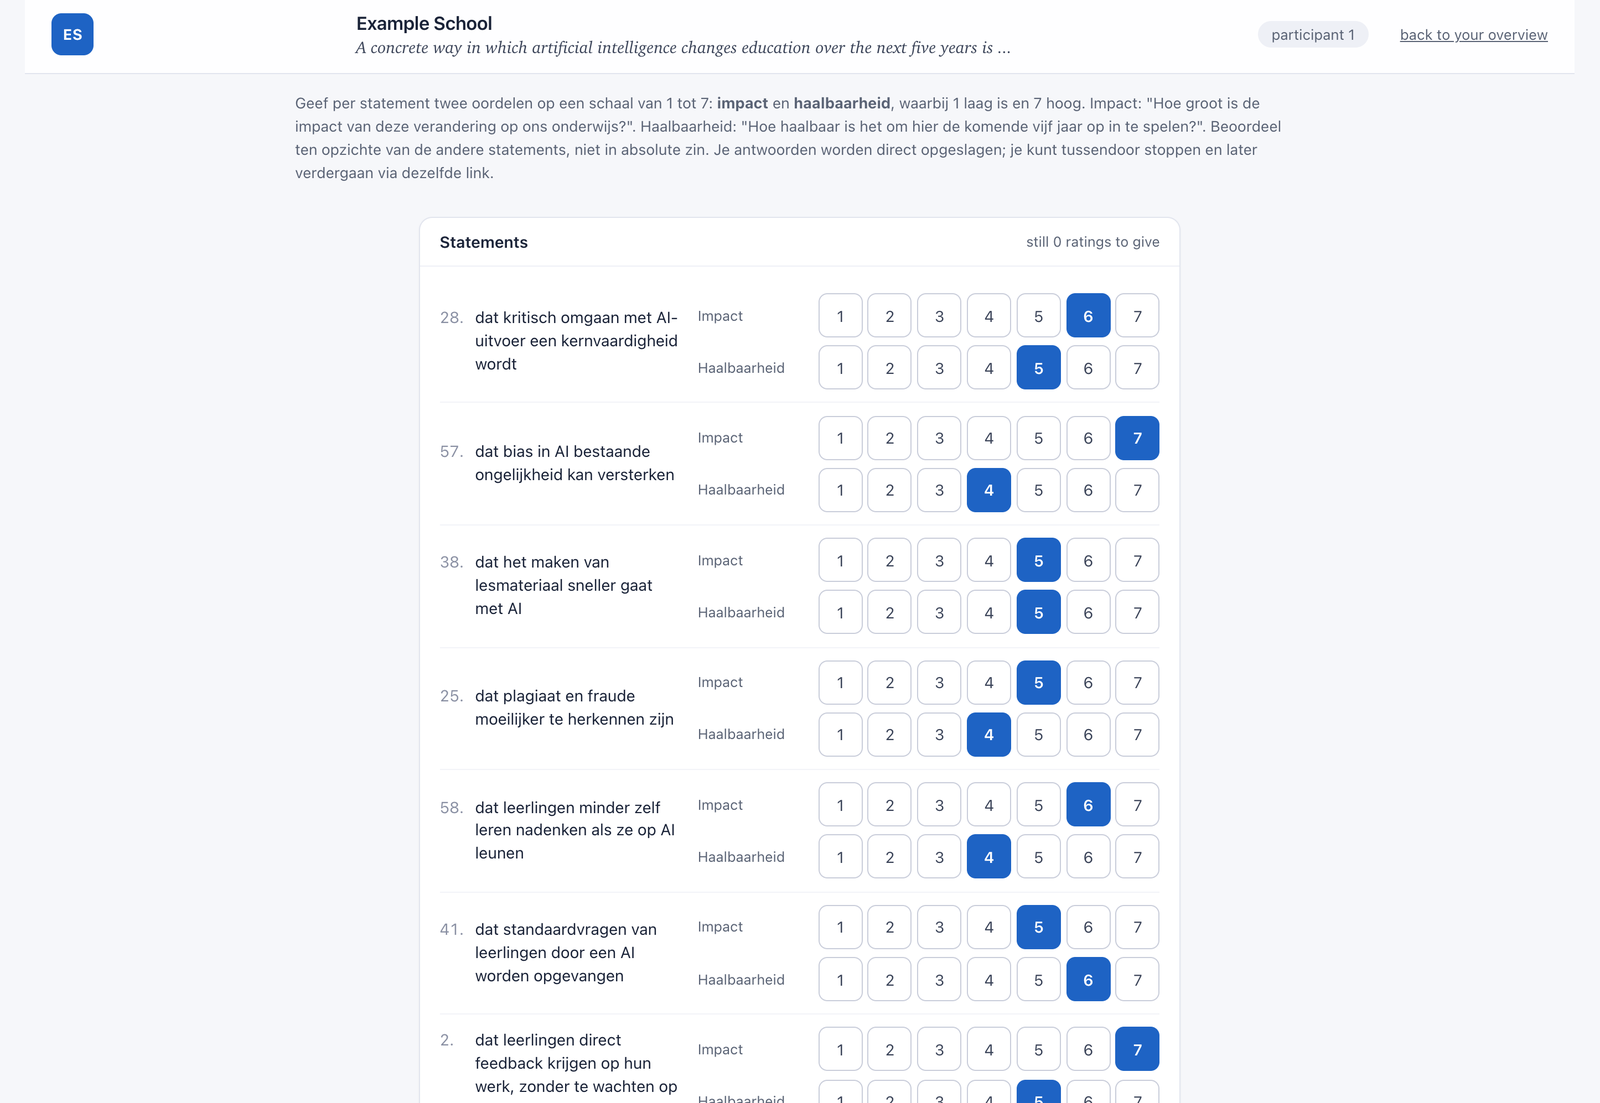
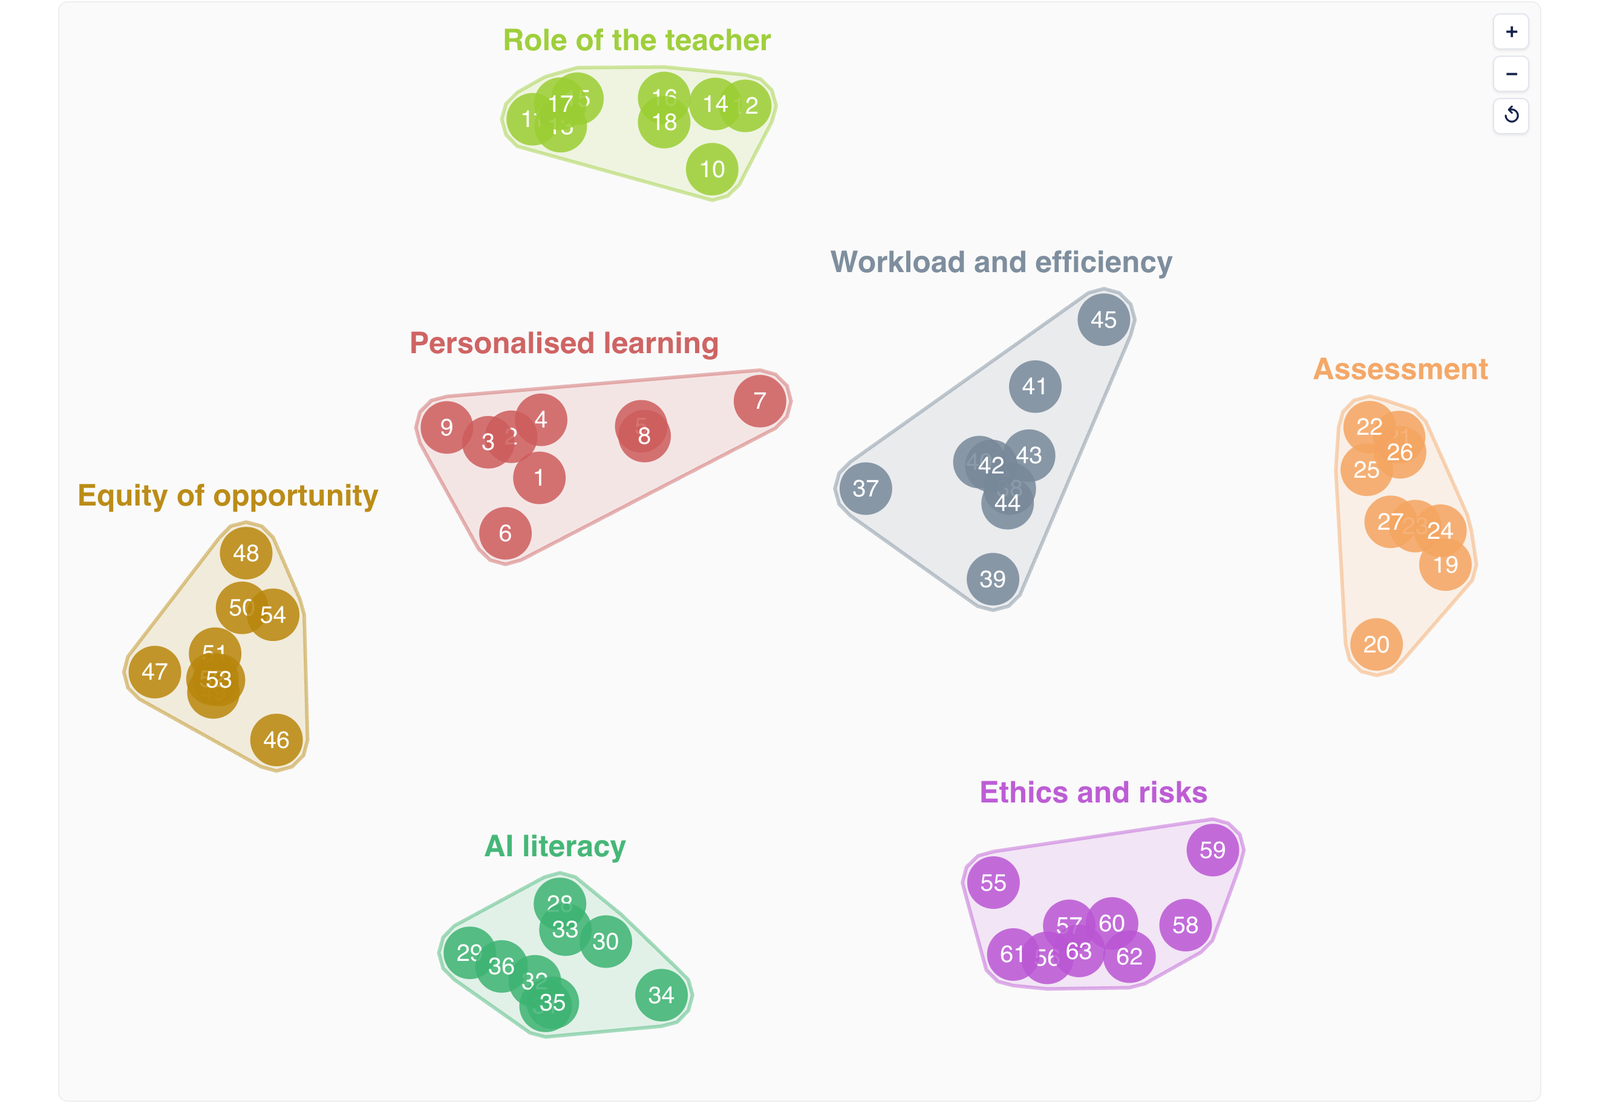
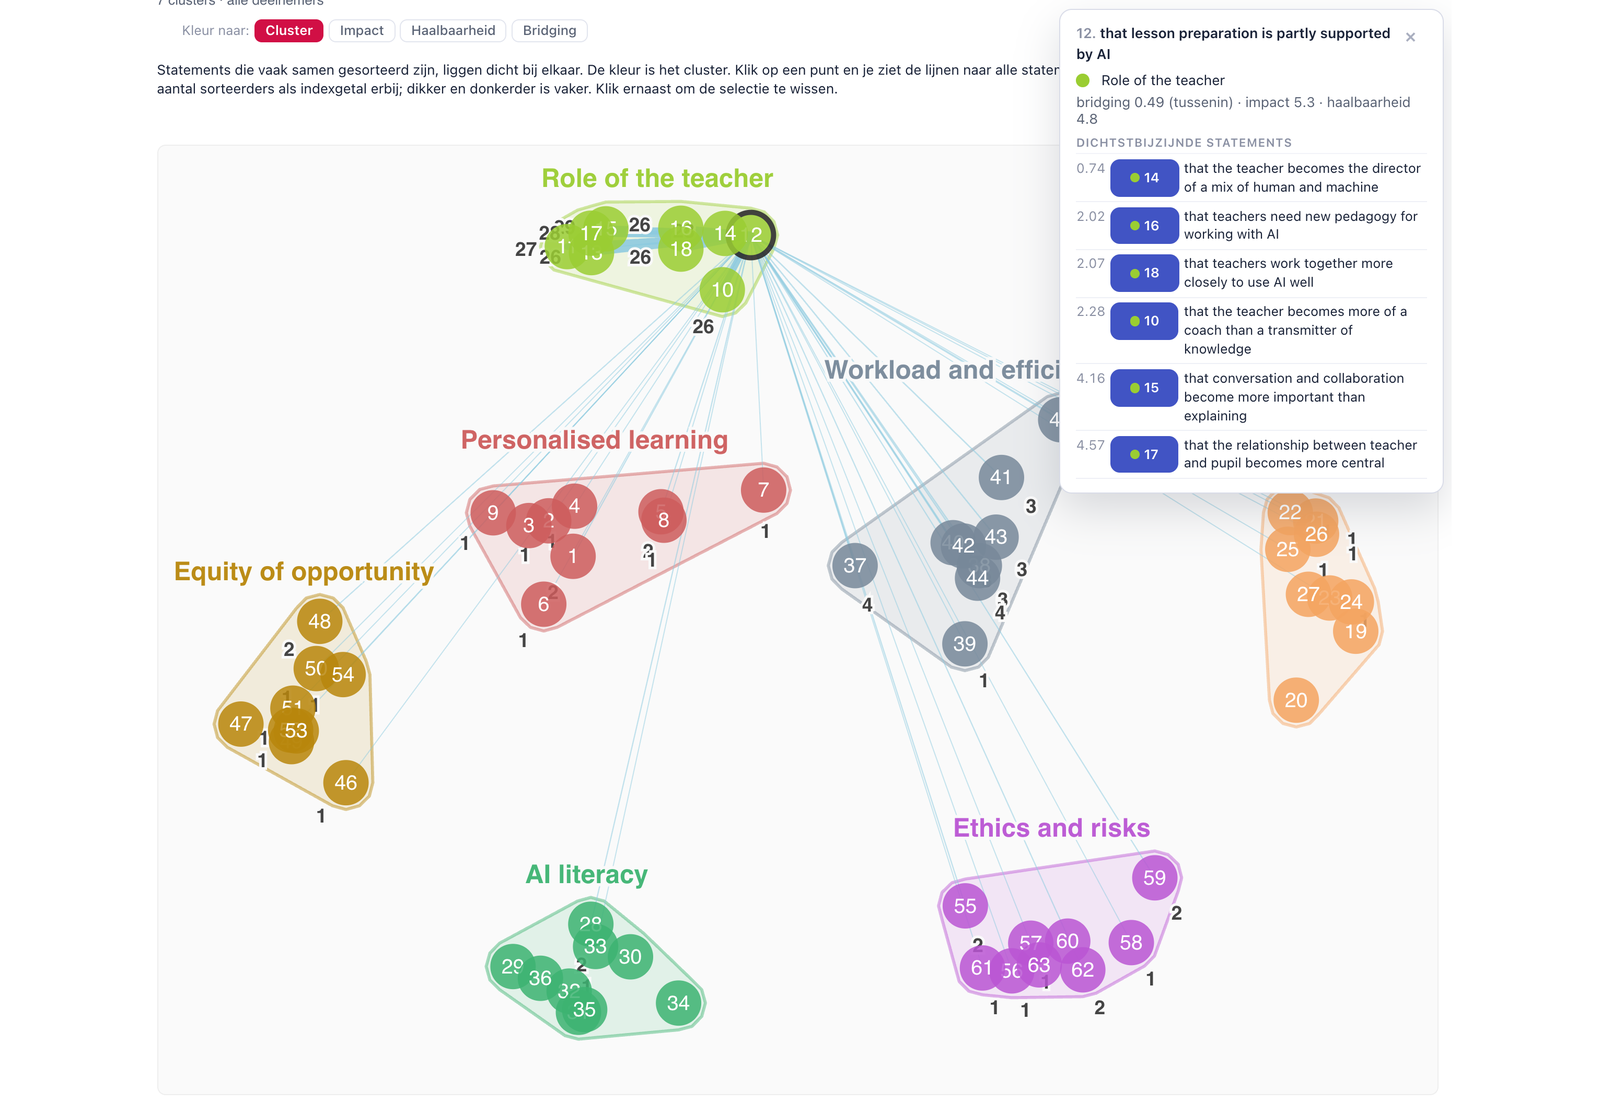
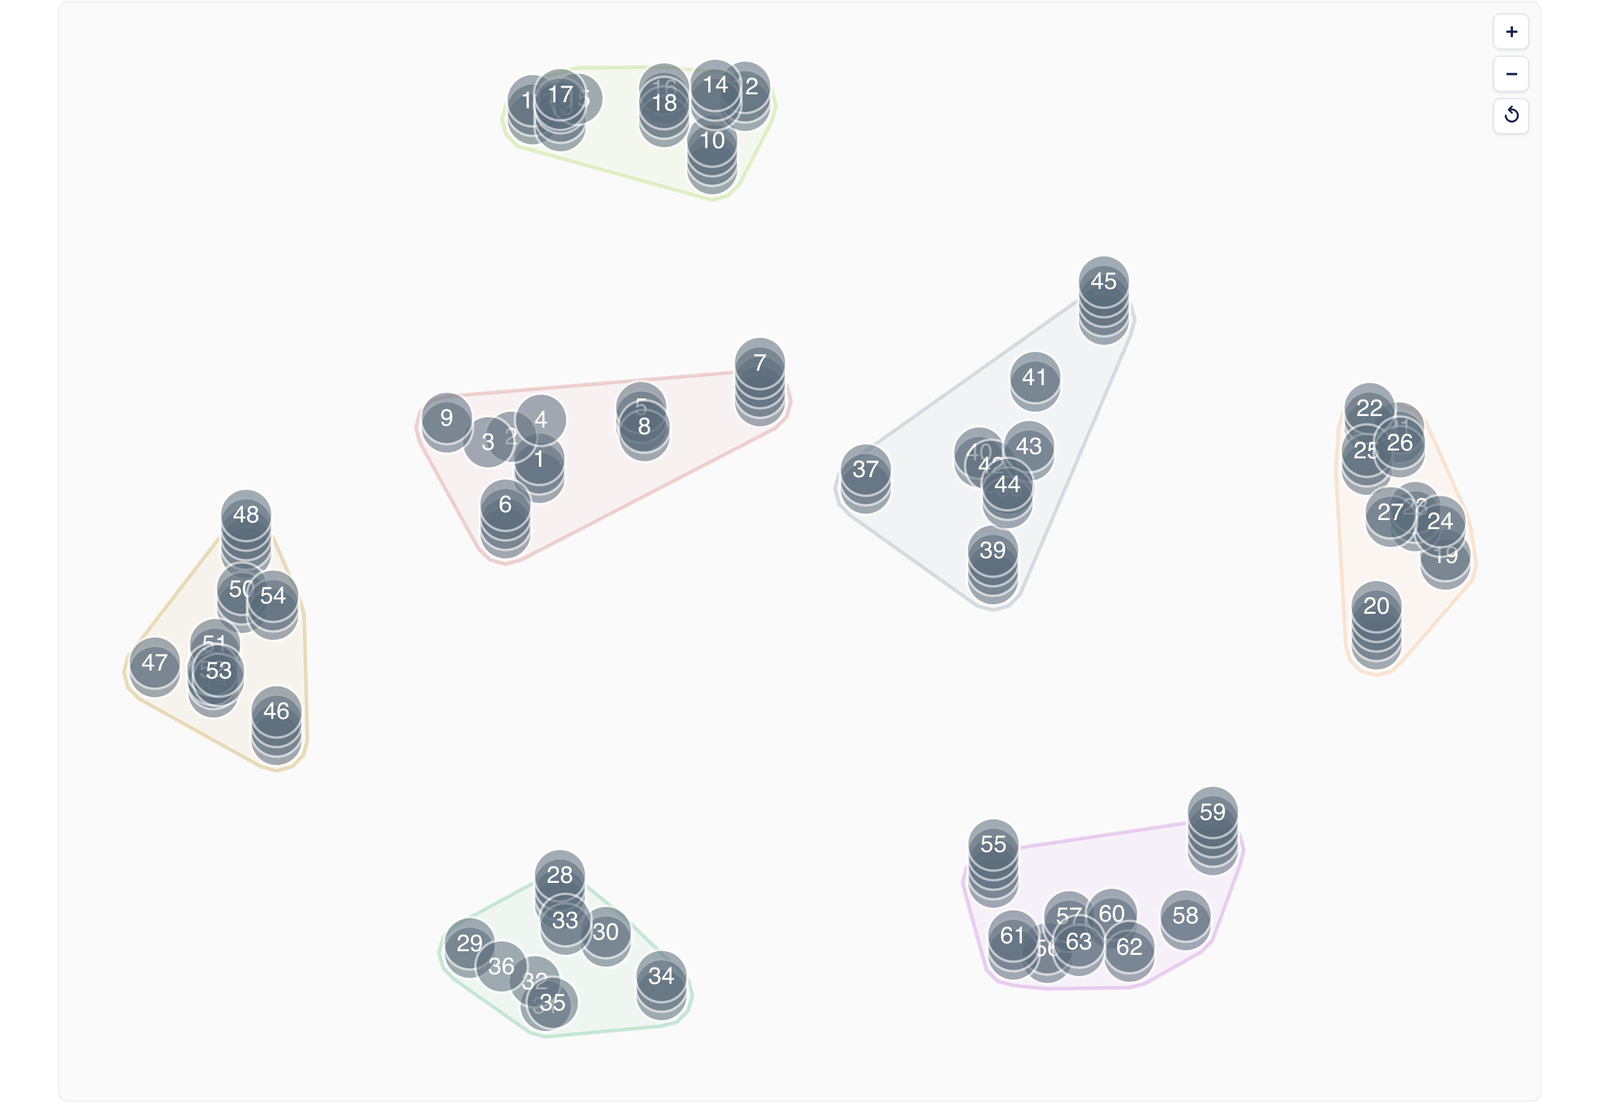
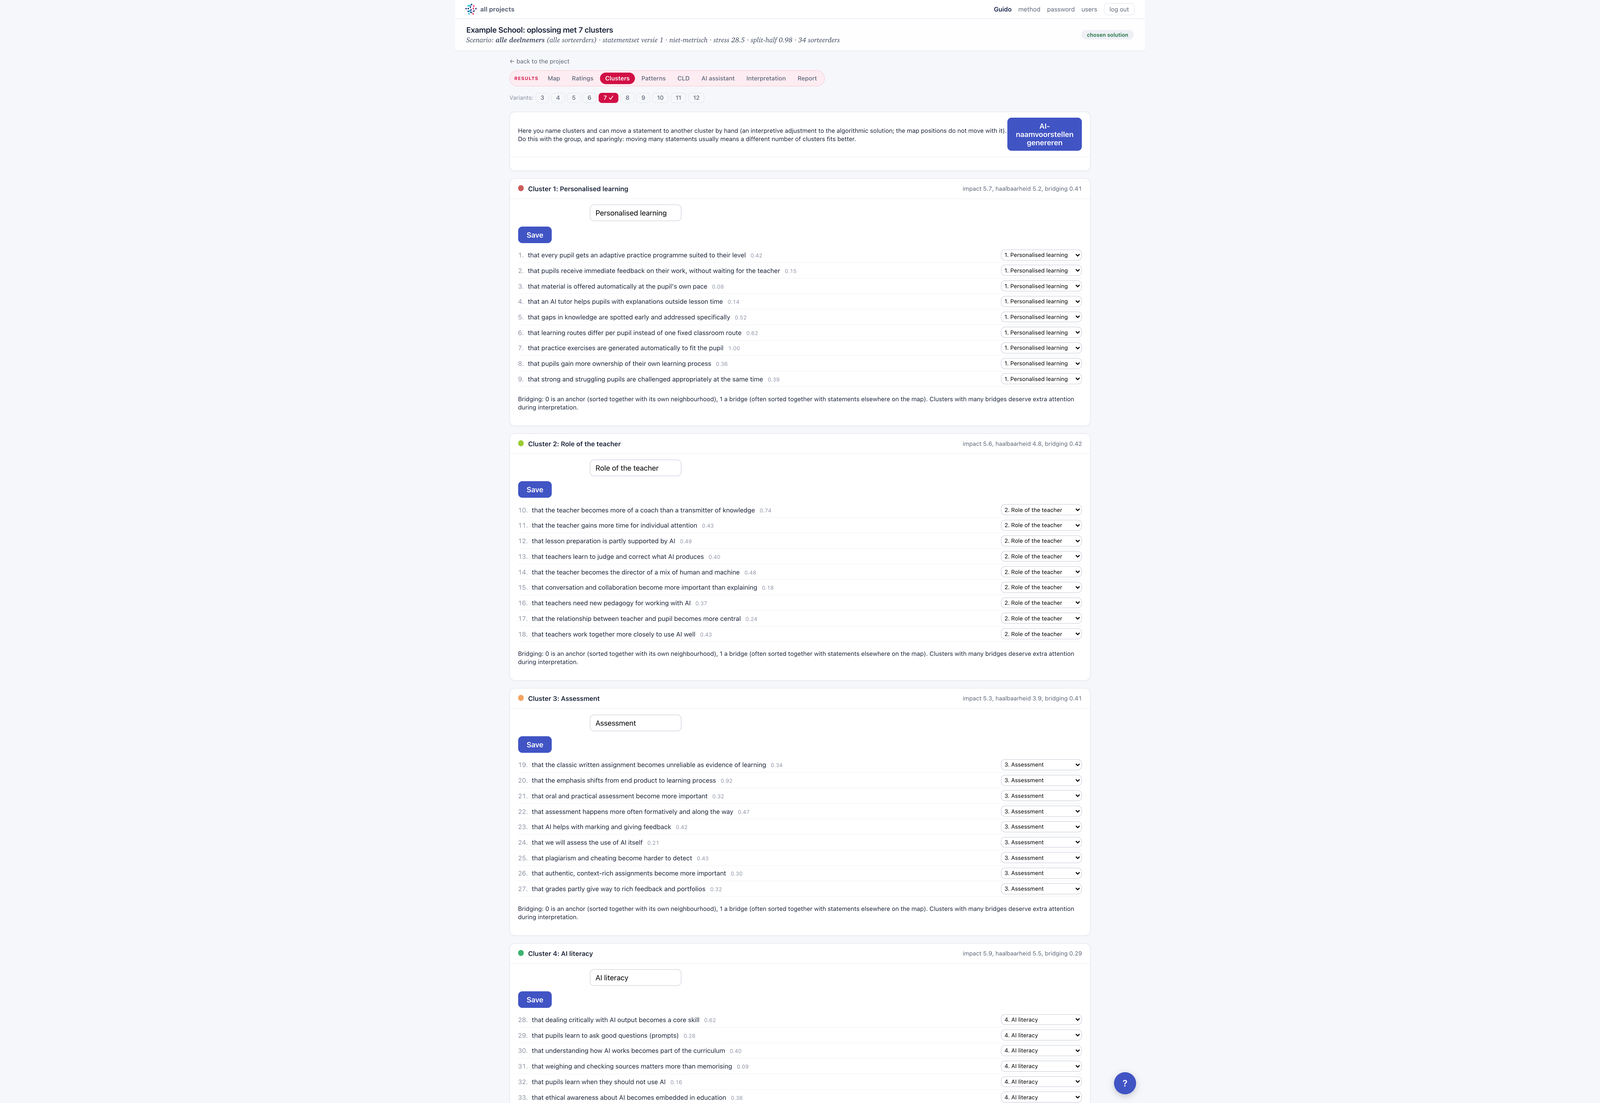
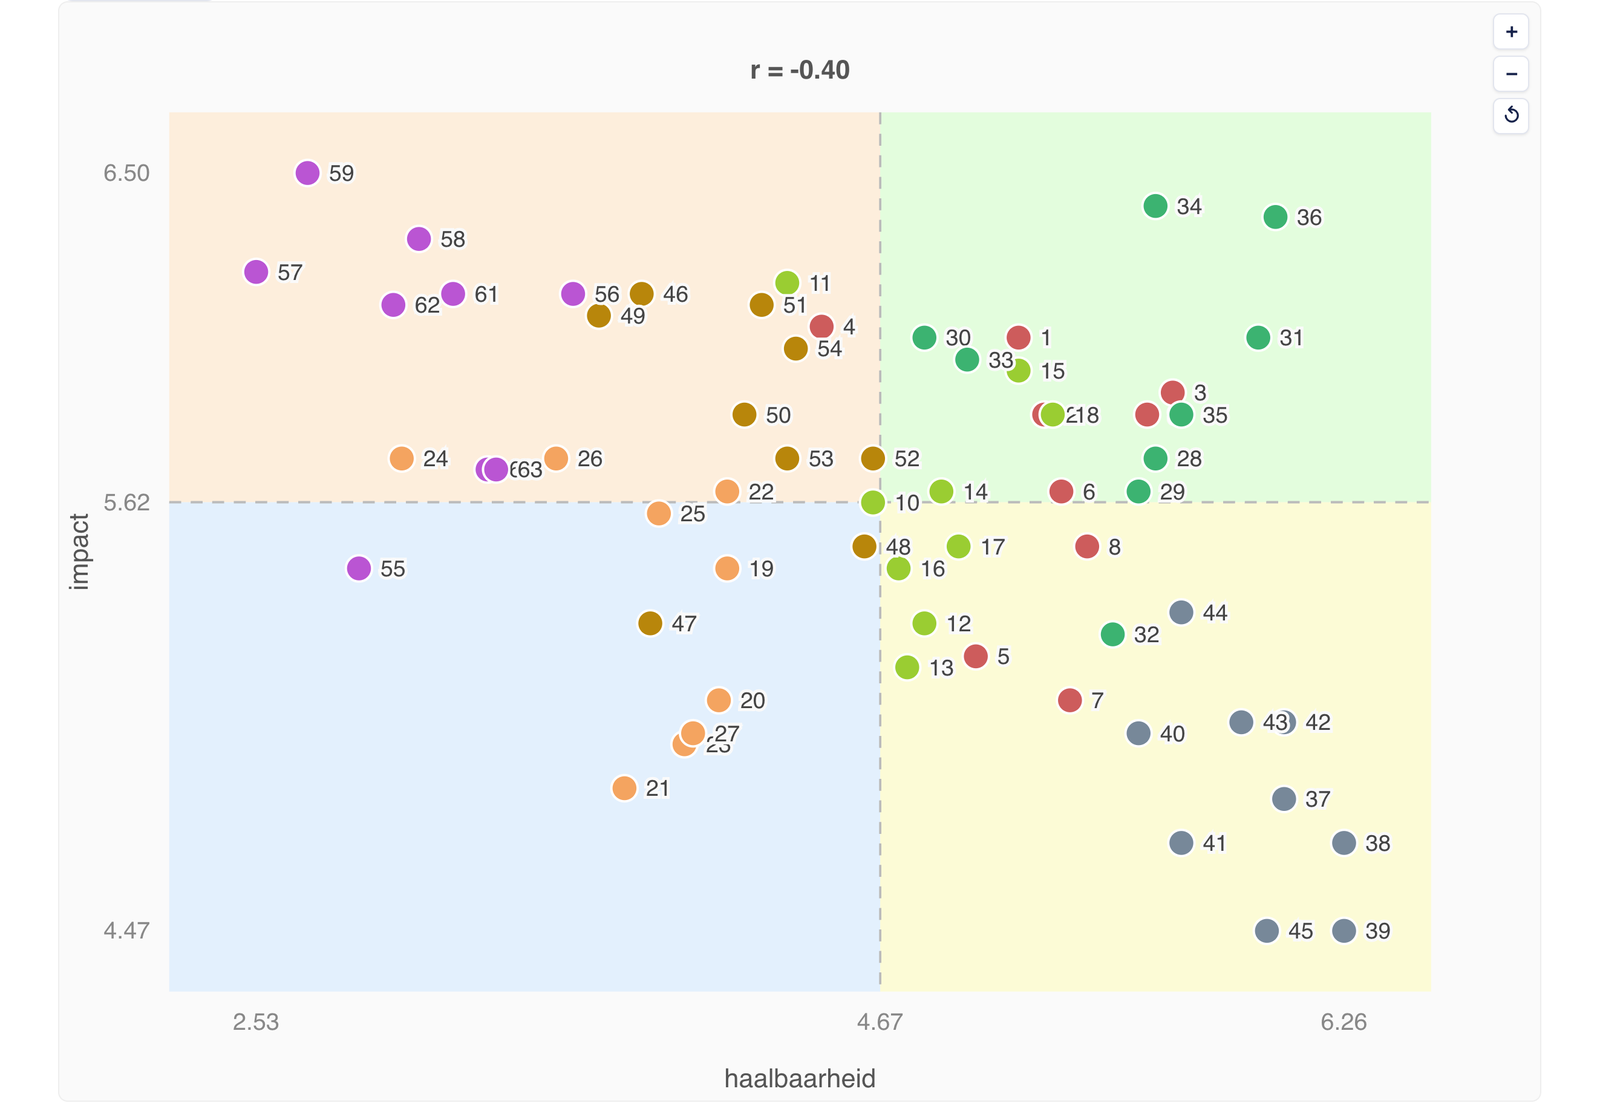
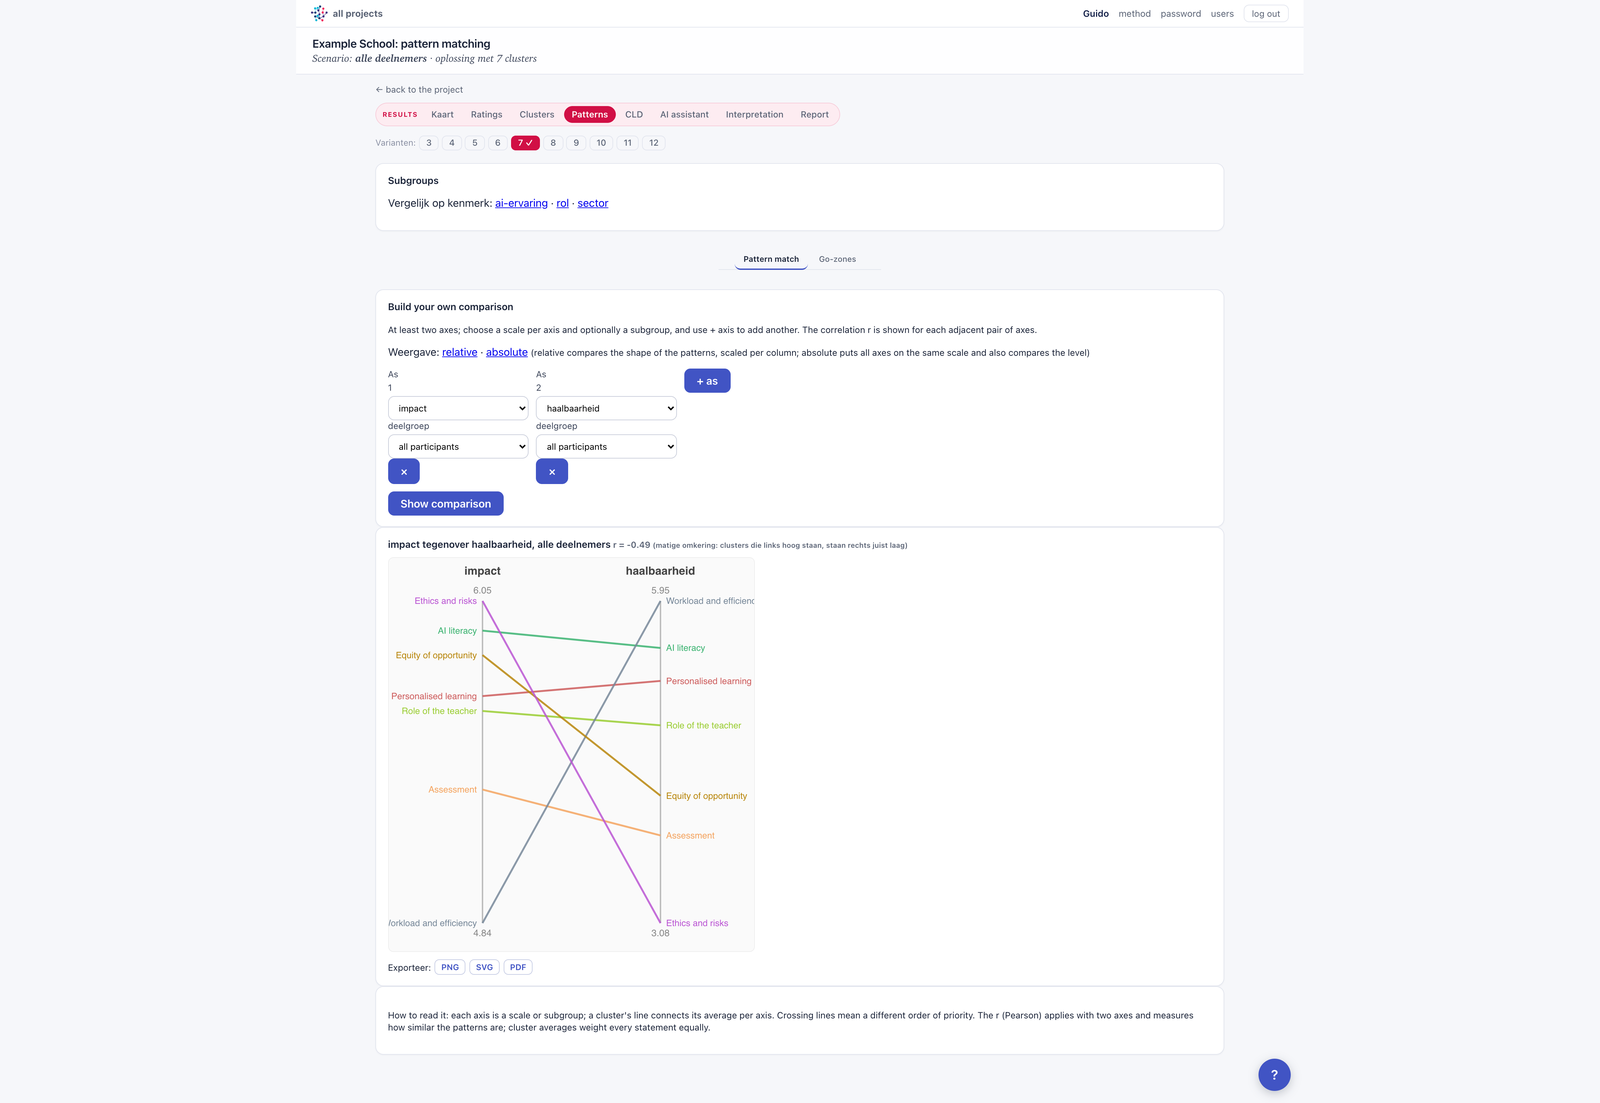
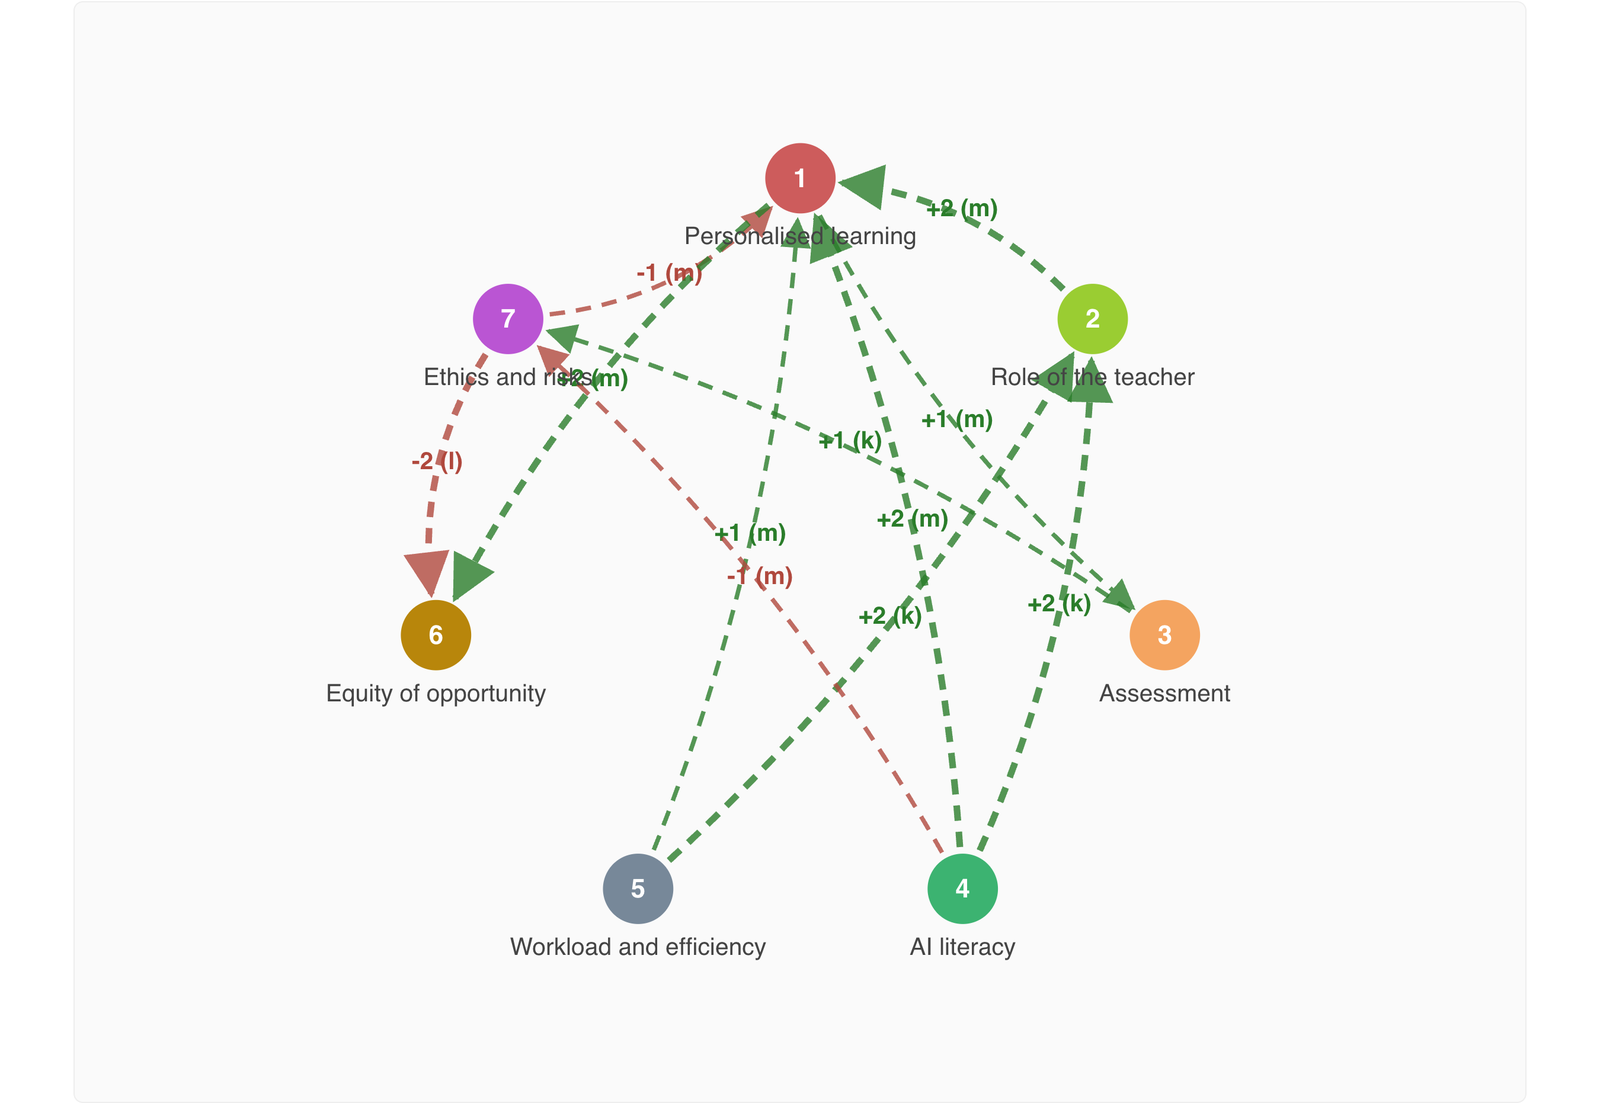
For inspiration
Group Concept Mapping fits wherever you want to turn the knowledge of a group into a shared, workable picture. A selection of the possibilities.
A board or management team asks the whole organisation where to focus in the coming years. Every voice counts equally, including the quiet ones.
Delivers: a prioritised map with broad support, and a go-zone of what is both important and feasible.
Teachers and students jointly define what makes a programme future-proof, and rate it on importance and feasibility.
Delivers: a pattern match showing exactly where staff and students see things differently.
Professionals and clients contribute what is really needed; the causal map shows which lever moves the most.
Delivers: a causal diagram with modelled scenarios.
Surface unfiltered what customers or members expect from a service, and cluster it into clear themes.
Delivers: themes with genuine support, without one loud voice deciding the outcome.
During a merger or reorganisation: collect both concerns and opportunities, and show where consensus sits and where tension does.
Delivers: a map that focuses the conversation on what actually matters.
Researchers use a validated concept map as the basis for a questionnaire, an intervention design or a theory.
Delivers: a statistically grounded structure, with full data export.
Two sides
The added value
Capture the causal relations between themes in a diagram, freeze it as a model, and push on one theme to see how the rest responds over time. That way you test a choice before you make it.
Privacy and hosting
The analysis runs on our own server in the Netherlands, not on a big-tech cloud. Your data stays in the Netherlands.
The AI only sees anonymous content (statements and themes), never personal data. A local model by default.
Participants work under a pseudonym through their own link.
All raw data as CSV, for accountability or your own analysis.
The deliverable
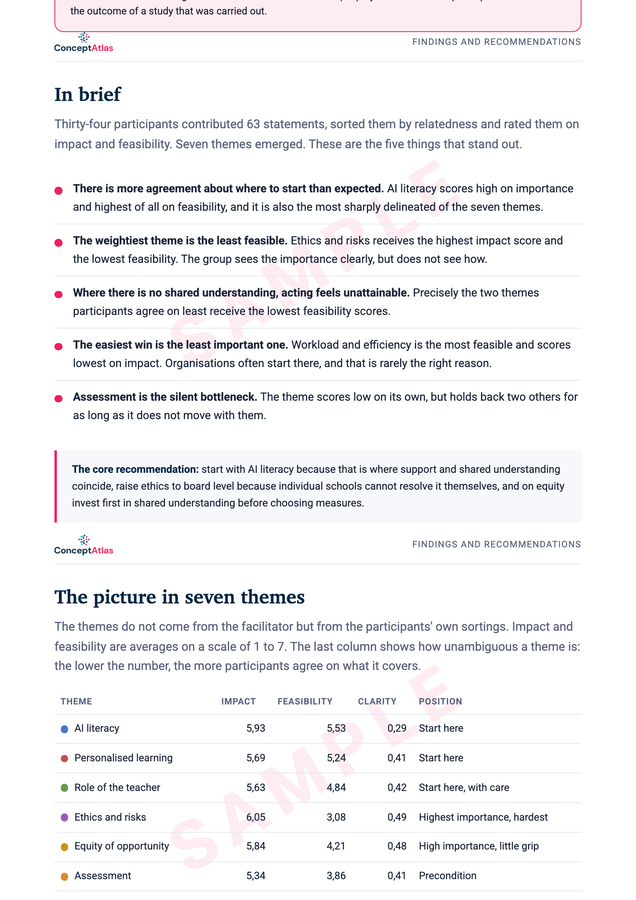
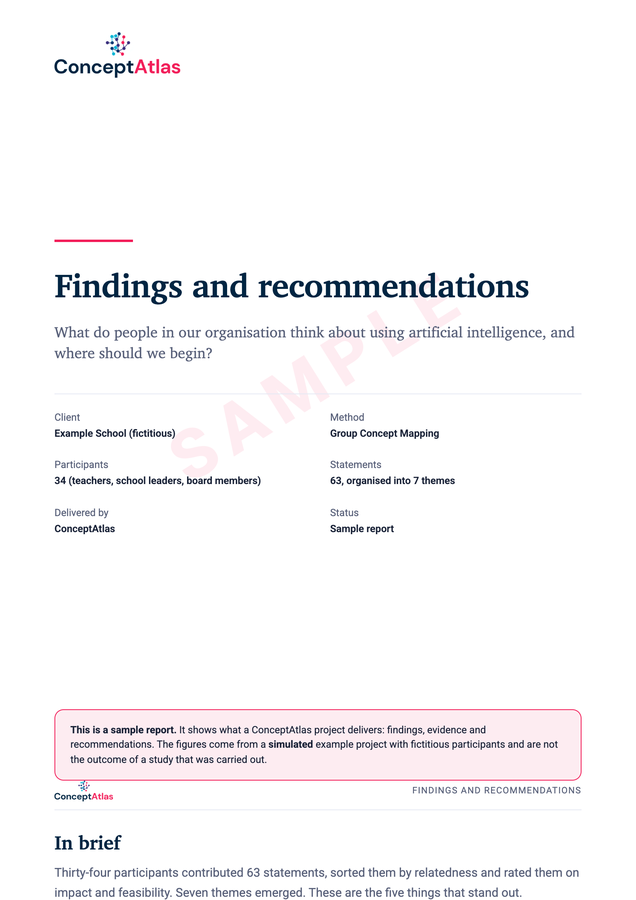
You do not get loose images, but a written report with findings and concrete recommendations, grounded in the figures and maps from the analysis.
10 pages. If you also want the underlying figures, see the statistical appendix. The figures come from a simulated example project with fictitious participants, not from a study that was carried out. See also the accountability and disclaimer.
Pricing
You pay per project, with tiers based on group size. Within a tier an extra participant costs nothing, so include everyone who has something to add. Prices exclude VAT.
from €2,750excl. VAT
Experience what the method delivers for your question.
from €6,750excl. VAT
From question to a supported decision, with the group at the table.
from €9,750excl. VAT
Also model what happens when you push on something.
Not sure which option fits? Put your question to us and we will tell you honestly what is needed. Even when that is less than you expected.
Frequently asked questions
A structured approach in which a group contributes ideas, sorts them by relatedness and rates them on, for example, importance and feasibility. The software turns that into a shared map using statistics (multidimensional scaling and clustering). The positions therefore come from the group, not from the facilitator.
It works from about ten people onwards and comes into its own with fifteen to forty. More is fine. Sorting can be done by a smaller group than the brainstorming and rating if needed.
No. Taking part happens through a personal link in the browser, including on a phone. Participants need no account, and anyone who stops halfway simply continues later.
For participants it is fifteen to thirty minutes per step, at their own pace. Most of the value emerges in the working session afterwards, where the group interprets the map together.
On our own server in the Netherlands, not in a US cloud. You receive all raw data as an export for your own archive or analysis. This also makes the setup straightforward for European projects with data protection requirements.
The AI is an assistant: it proposes cluster names and helps sharpen insights, always with reference to the underlying statements. It only sees anonymous content, never who said what. If you prefer nothing to leave the building, the interpretation can run entirely locally on our server.
No. In a survey the author decides the questions and the answers in advance. Here the participants determine the content, and which themes exist follows from their own sortings. So you do not measure what you already thought of, you discover what is actually there.
Yes. Go-zones and pattern matching let you compare, for example, importance against feasibility, or one group against another. That shows at a glance where the picture matches and where it diverges. For international consortia this is often the most revealing view: the same map, different countries.
You pay per project, not per participant. An exploration starts at €2,750 (up to 30 participants), a full project with a working session at €6,750 (up to 75 participants), and with modelled scenarios at €9,750 (excluding VAT). Larger groups cost slightly more, because there are more ideas to synthesise. The full breakdown is under Pricing.
ConceptAtlas carries out the analysis. Boards, schools, universities and research consortia take it as a service: you supply the group and the question, we deliver the map, the modelling and the report. Delivery in English is included.
Contact
Want to ask a question or request a demo? Let us know and we will reply quickly.
Request a demo or ask your question. We are happy to show what Group Concept Mapping can do for your case.
Get in touch